The rapid expansion of global urban landscapes demands tools that allow professionals to visualize, analyze, and interact with 3D building data. In the realm of urban planning and architecture, 3D visualizations are the bridge between a concept and its realization.
ArcGIS, renowned for its geospatial capabilities, has carved a niche in this area by offering powerful tools to transform raw 3D building data into visually rich and interactive models.
Here, we will give you exact step-by-step instructions on how to get your 3D building data into ArcGIS Online and adapt it to create captivating visual effects.
If you're using ArcGIS Pro, click here for our article specific to visualizing 3D building data in ArcGIS Pro.
- If you haven't already got 3D building data for your project or area of interest, download it from our data page [link]. Make sure you use a coupon code to get $50 credit!
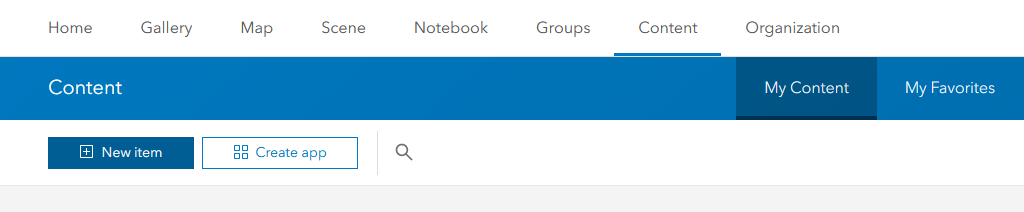
- Open ArcGIS online, sign in, and click on "content" - "new item":
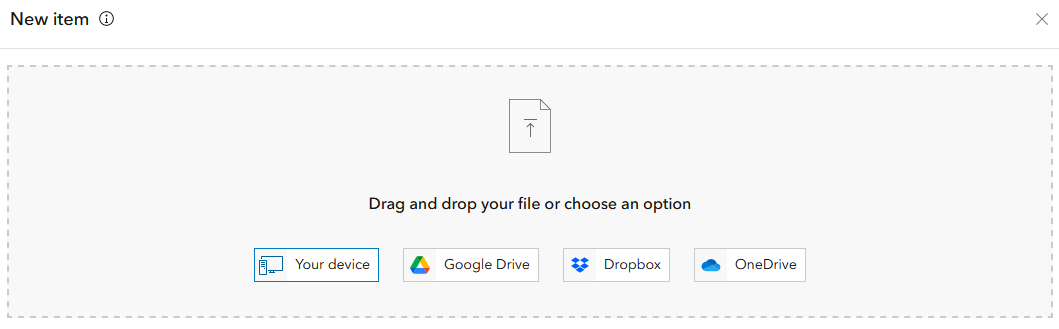
- then select from "your device" or drag and drop the JSON file into the upload box:
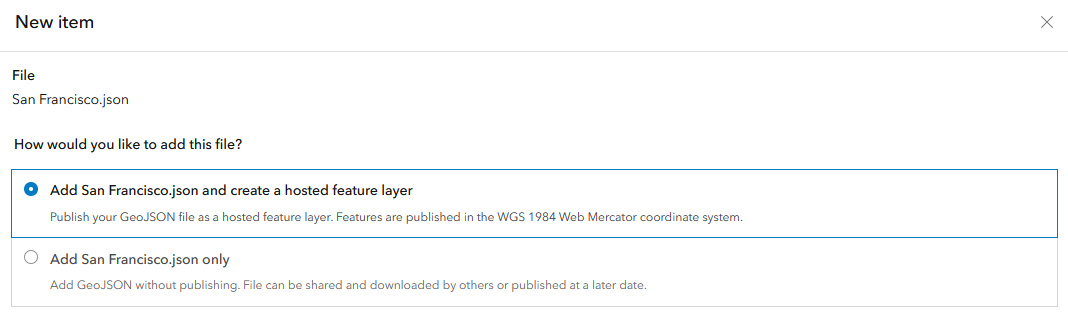
- Select the option "add" [JSON file] and create a hosted layer:
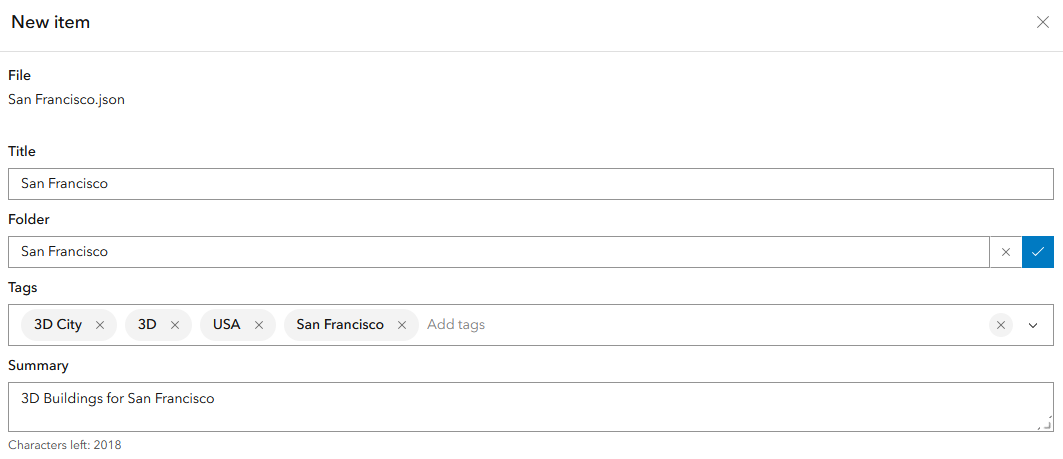
- Select the folder, give it a title, and add any relevant tags and a summary and click "save". It may take a minute to create the hosted feature service.
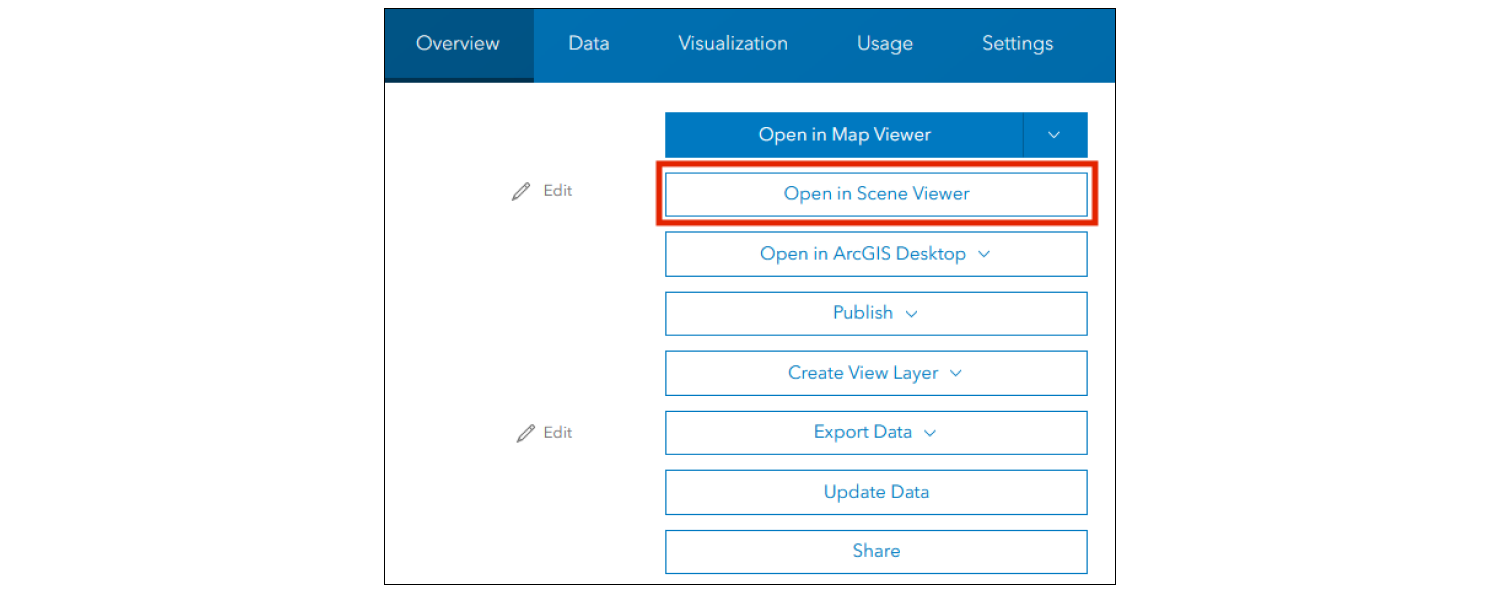
- Click "Open in Scene Viewer":
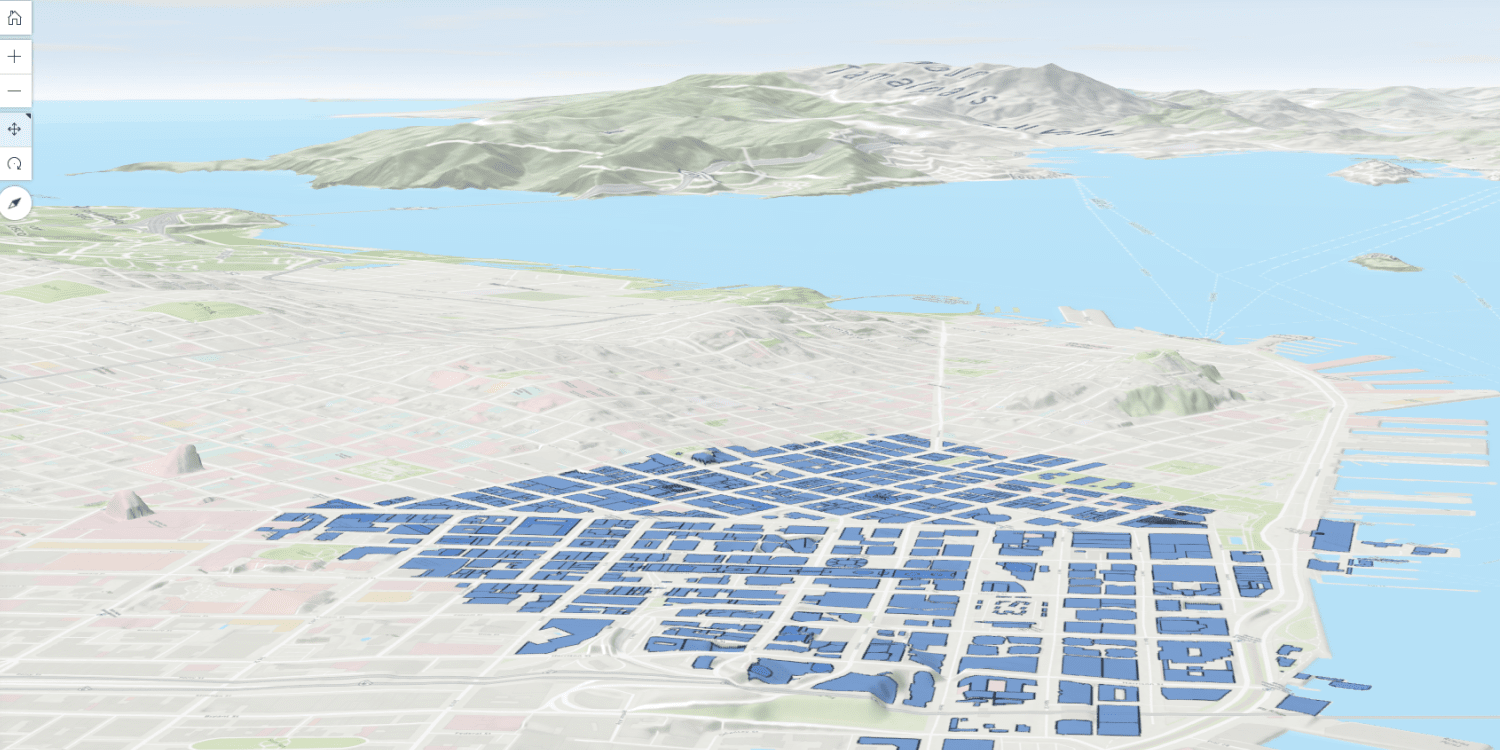
- The building data will appear in the correct location but will be in 2D:
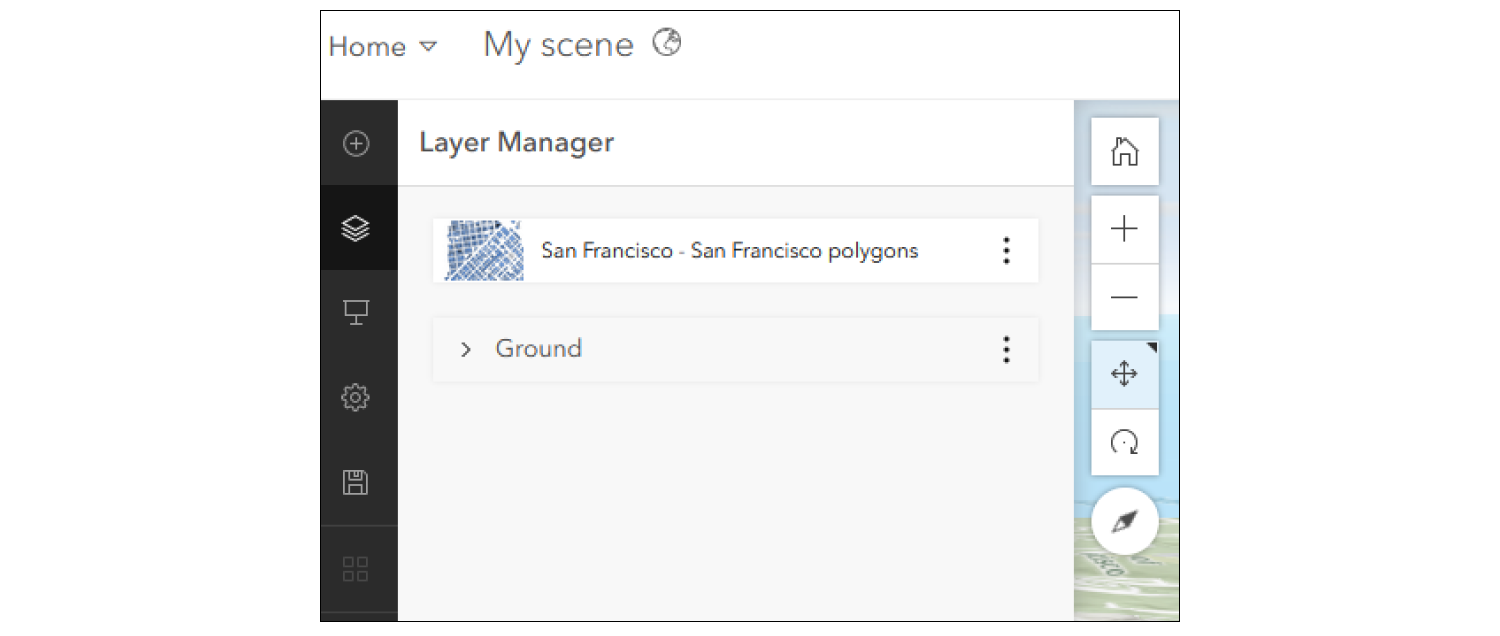
- Click on the layer in the layer manager on the left to open the settings to visualize the data in 3D:
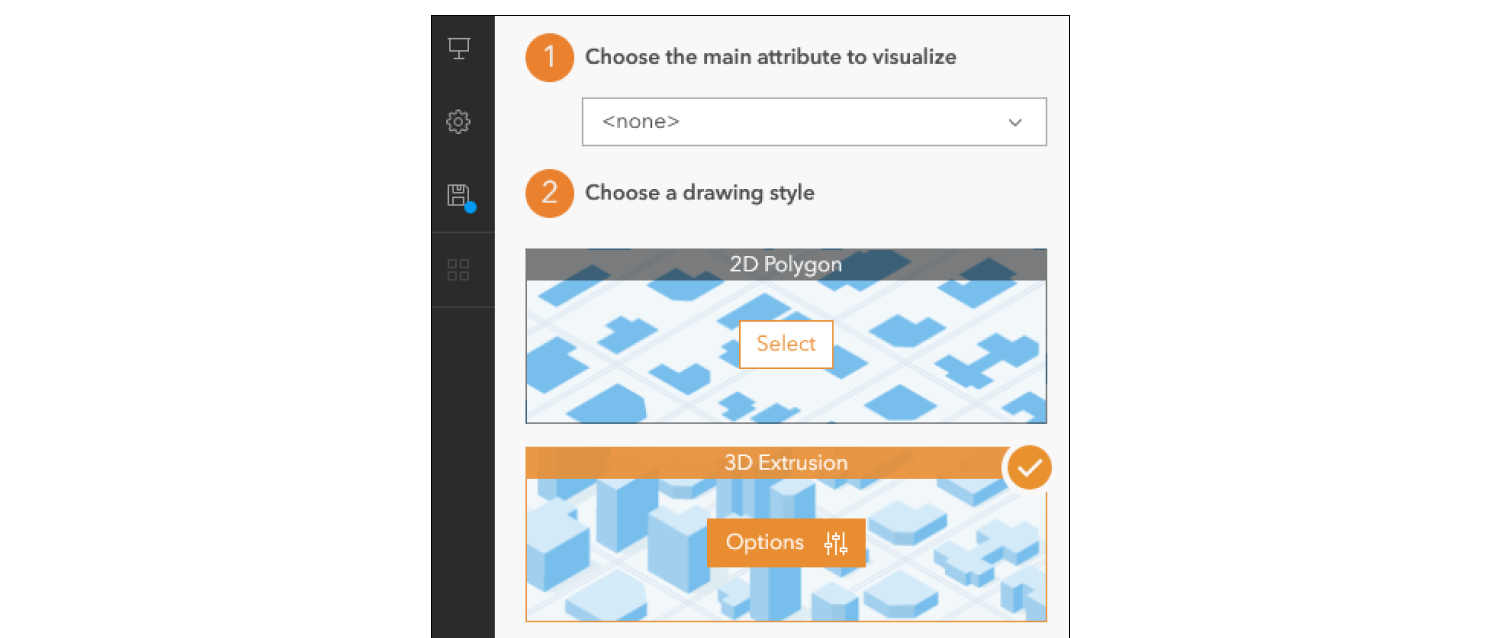
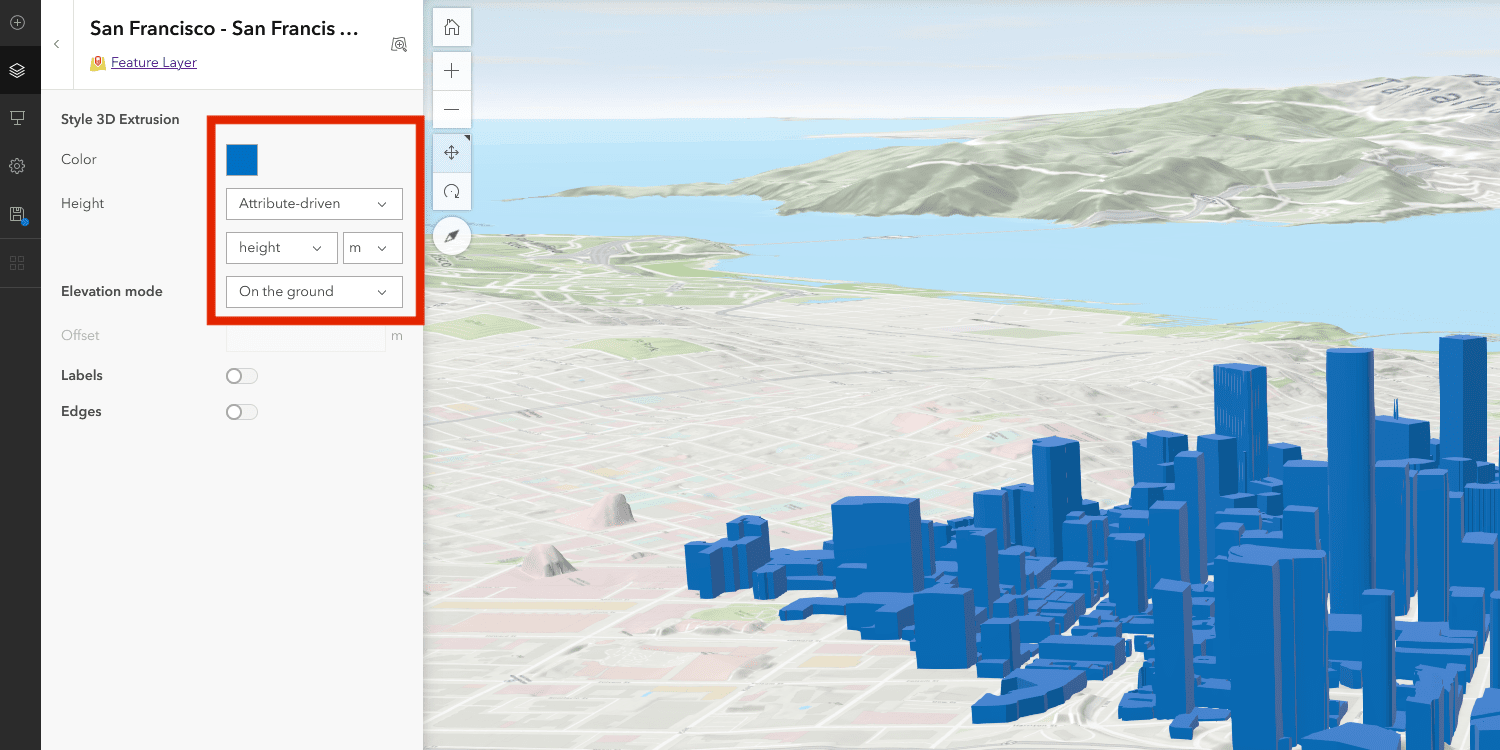
- Click on 3D extrusion:
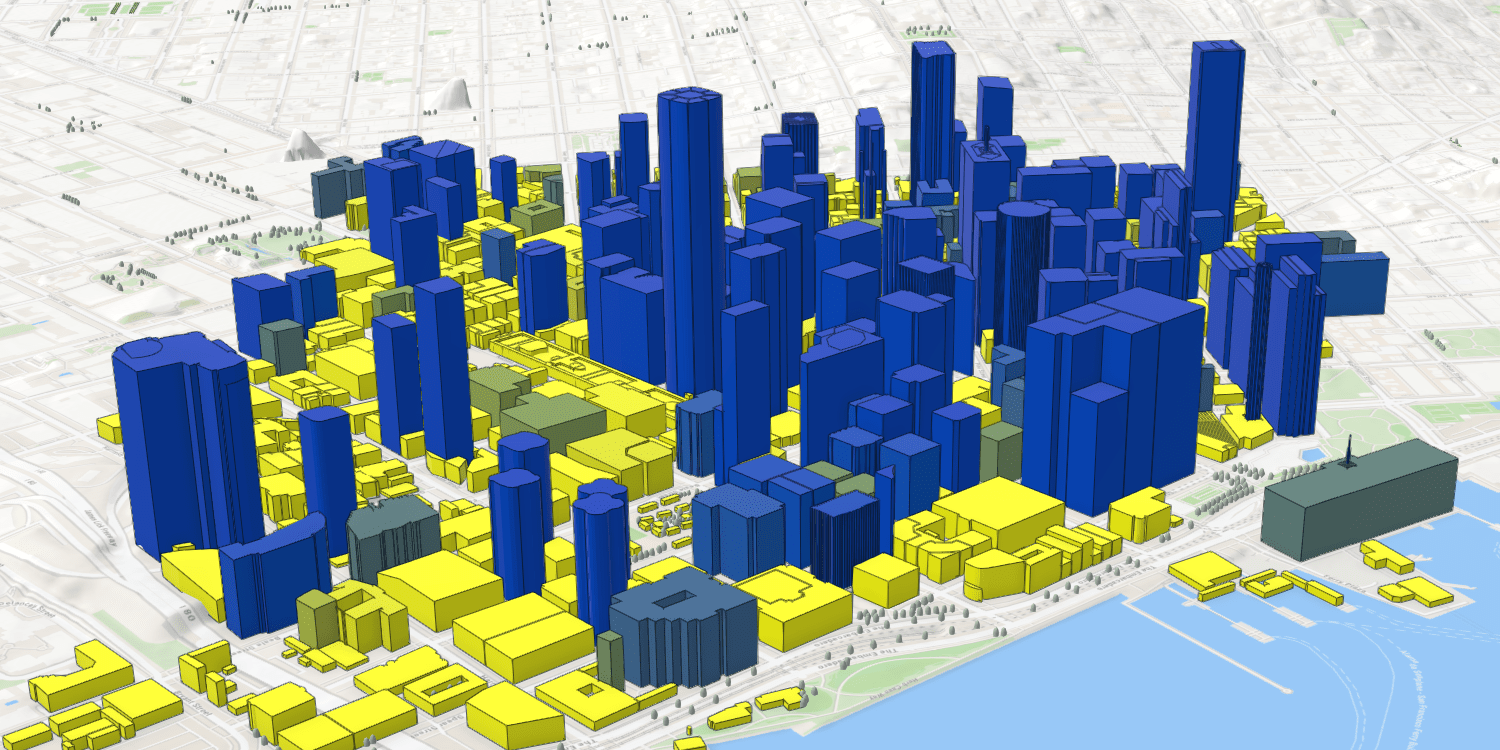
- Change the height from "fixed size" to "attribute driven" and select "height" in the field below this selection option and the data will appear in 3D:
- Activate "labels" and select the attribute you would like to show, e.g., building height, building name, etc.
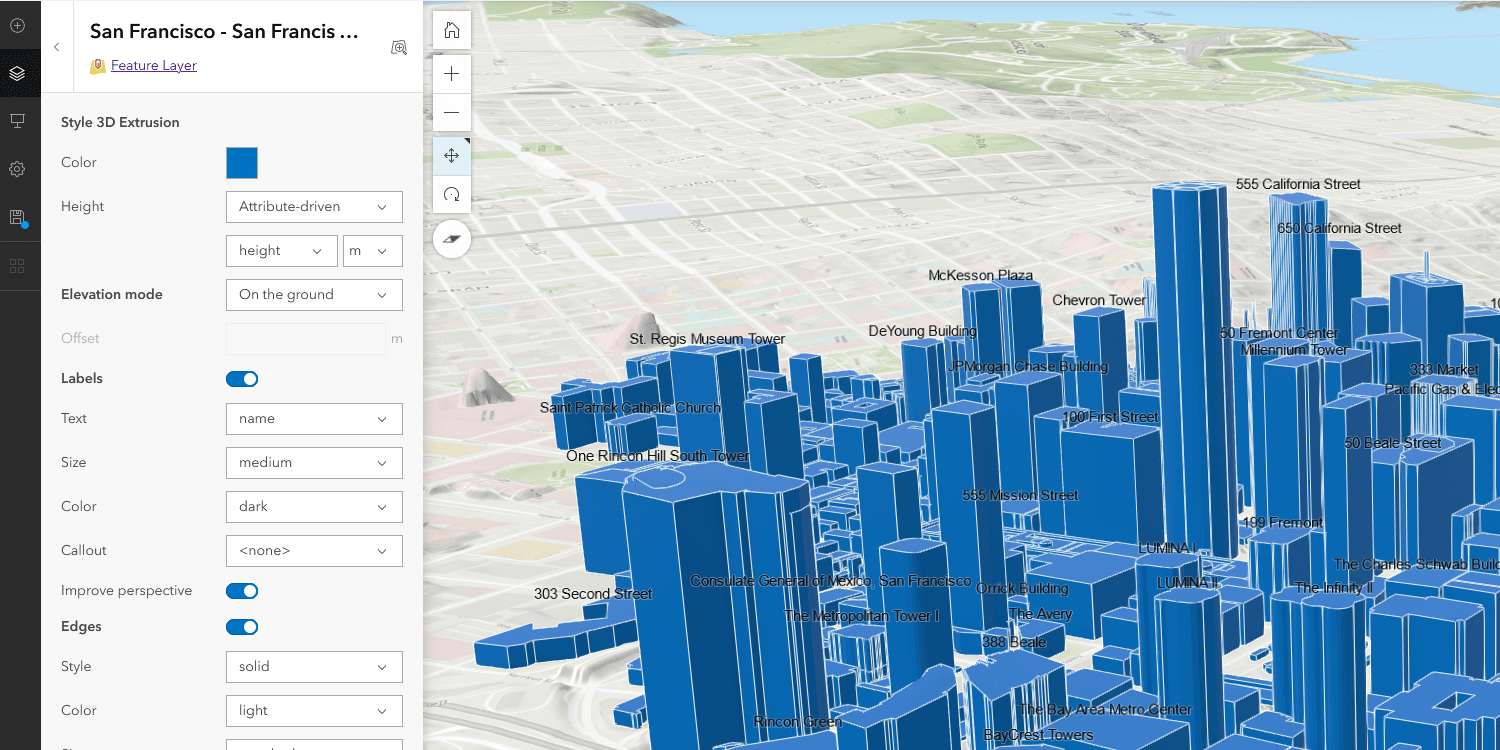
- Activate "edges" to visualize the building edges in different ways – play around with the setting to see different effects, such as "sketch", which is a nice visualization effect for city planning, for example.
- Clicking "done" once you have the desired set-up takes you back to the main menu on the left, where you can choose the main attribute to visualize. You can change this to e.g., height. Different further options will appear depending on which main attribute you select to visualize. In this example, we are going to use the "height" attribute.
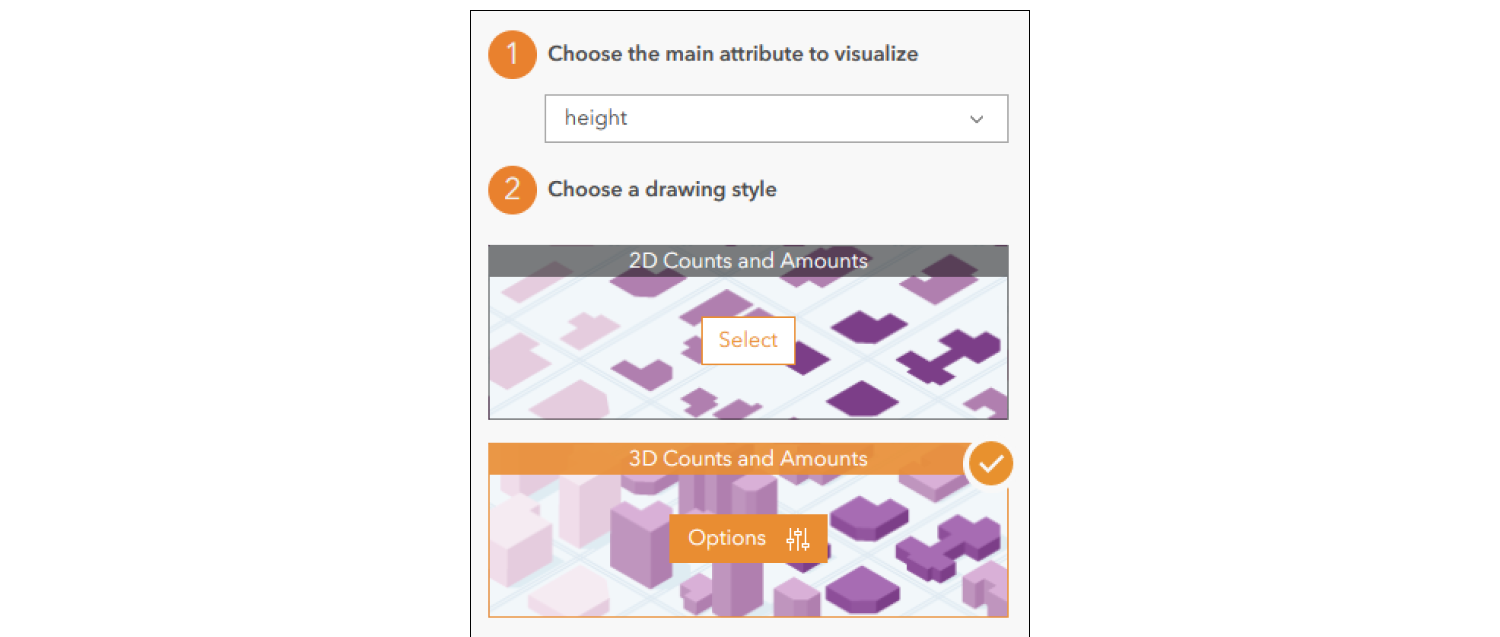
- Click "options" under "3D counts and amounts"
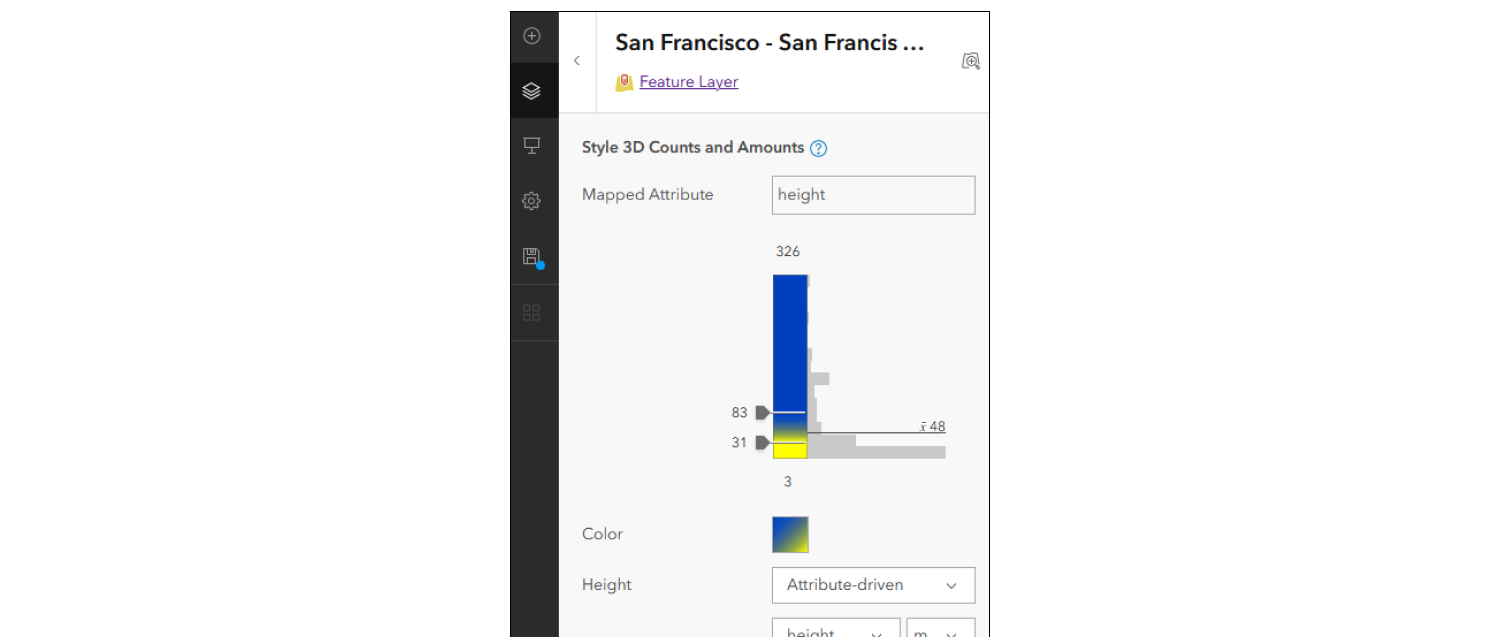
- Here, you must again change the "height" to "attribute driven" and select "height" in the attribute field below this selection option.
- Now you can change the color ramp by clicking on the color icon. Click "done" when you have selected the color ramp of your choice.
- ArcGIS online or living atlas provide a range of different layers and base maps you can choose to add to your map:
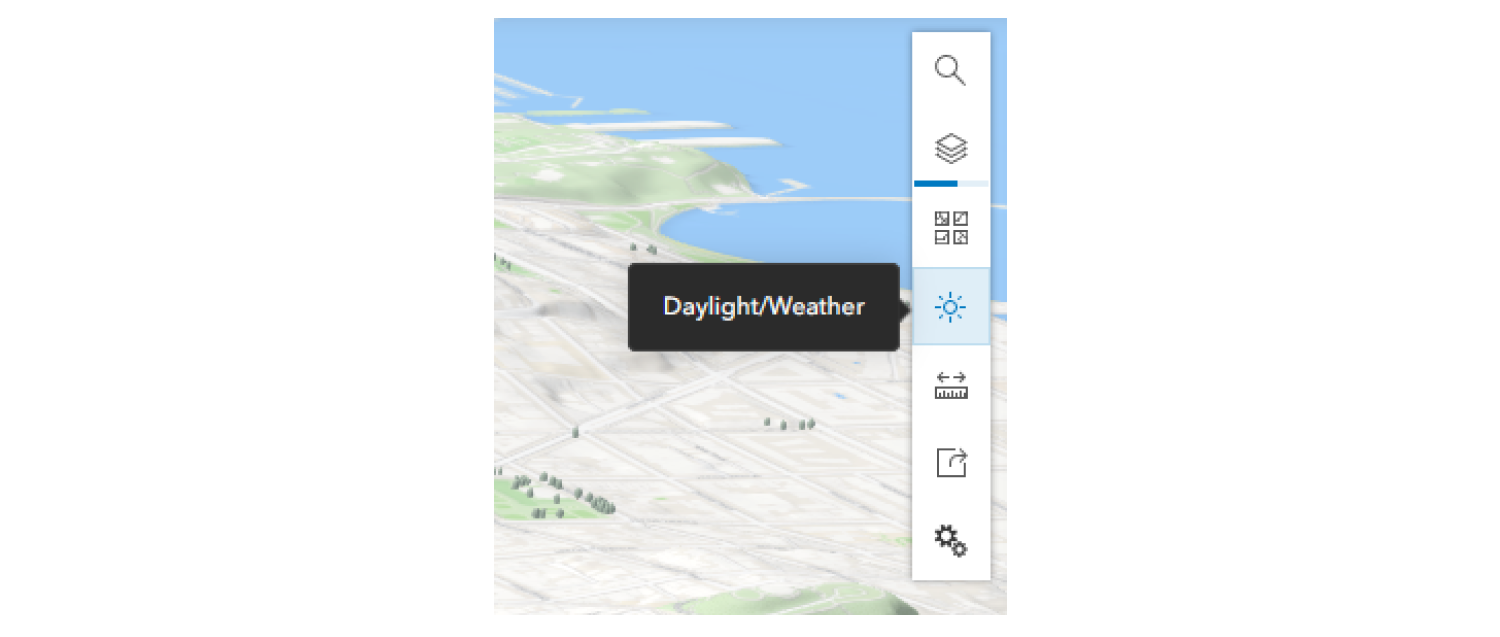
- Under "menu" on the right-hand side, you can select "daylight / weather" and for example, enable shadows or change the weather conditions.
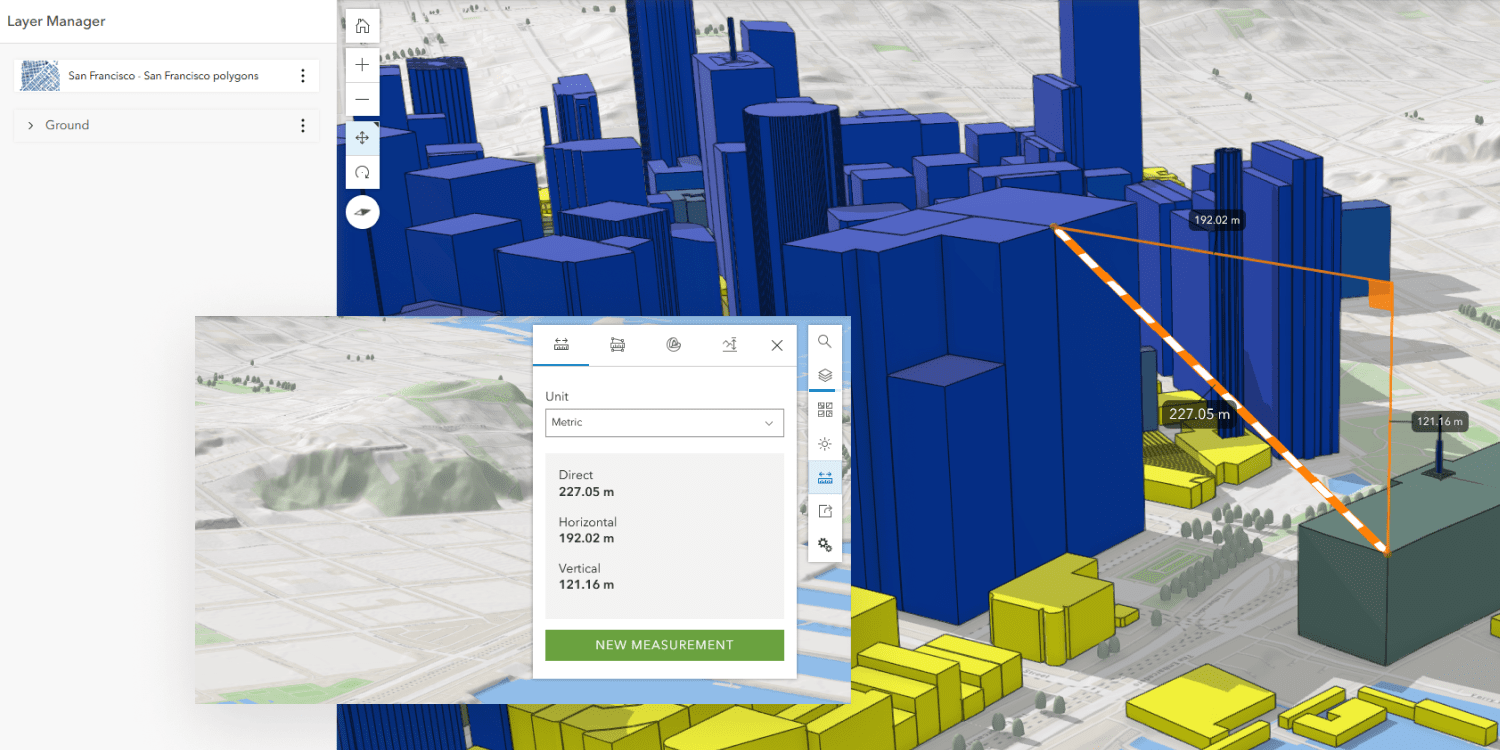
- Under "menu" - "analyse" you can carry out different analyses, e.g., measure areas, distances, slice objects or obtain an elevation profile:
- Under "daylight" you can change the time of day and day of the year to see how the daylight angles and shadows of the building change as a result.
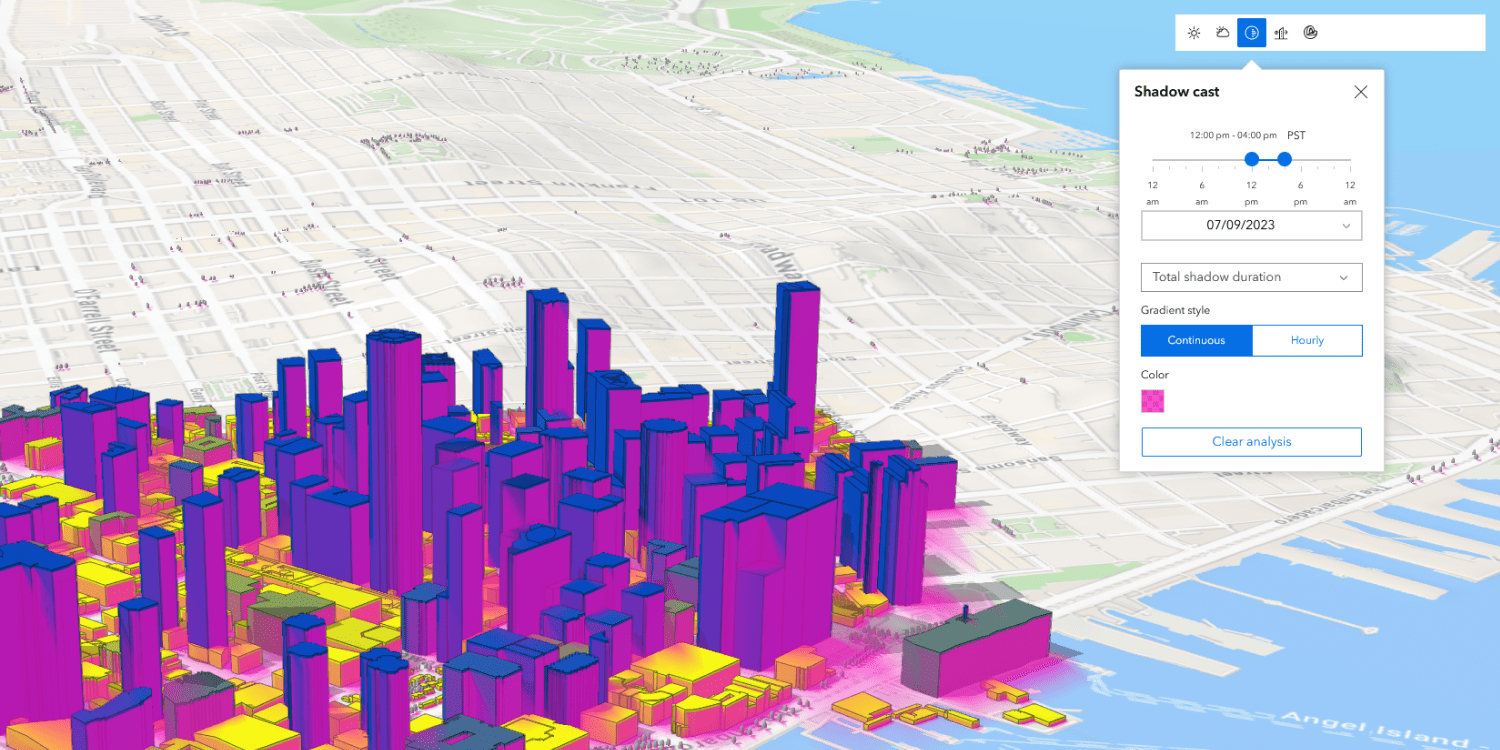
- You can use the newly created scene in "experience builder" to do further analysis, such as, e.g., looking at shadow casting, which allows you to look at which areas will have at least x number of hours of shade within a certain timeframe you define. In this example, the pink color denotes areas in the shade between 12pm and 4pm.
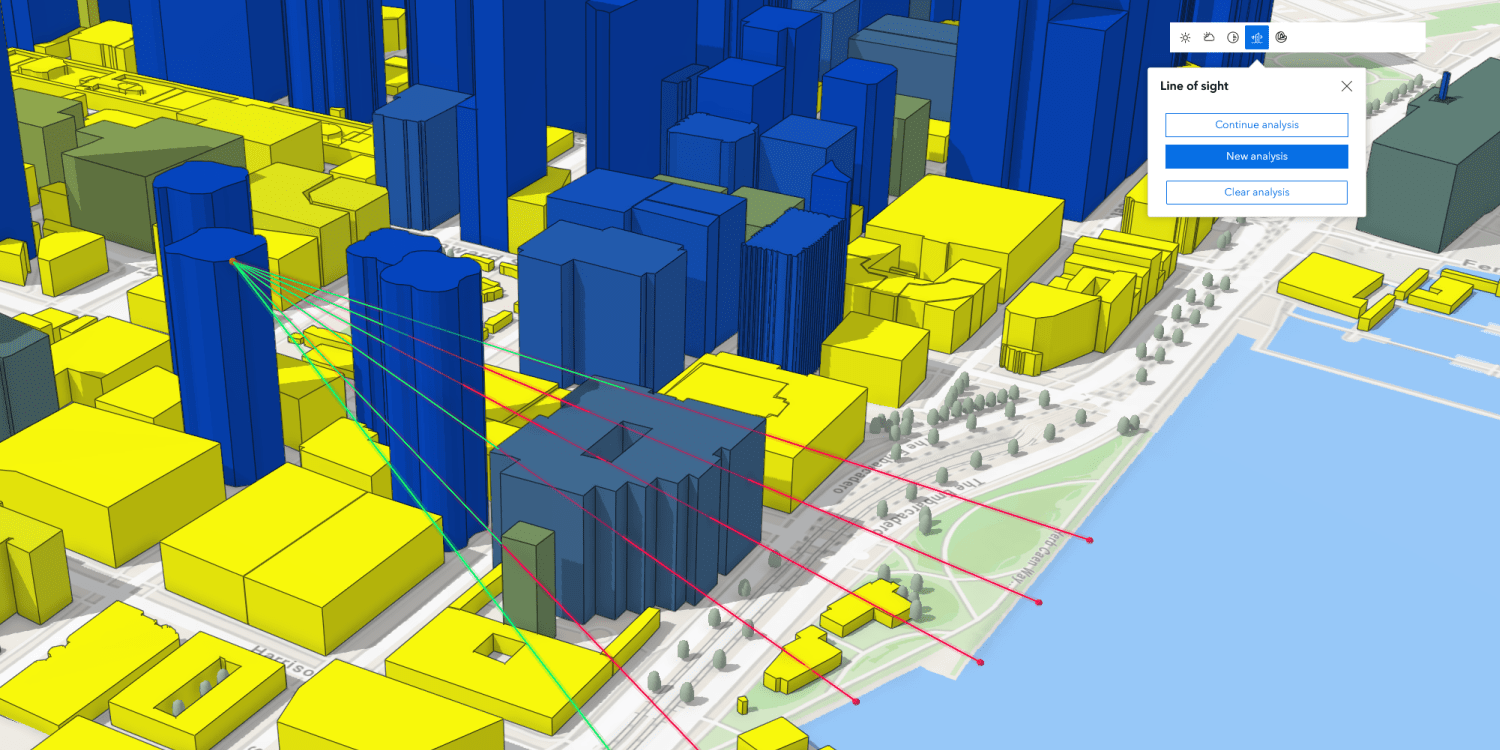
- Another possible analysis in "experience builder", is a "line of sight analysis" to determine the line of sight from a certain vantage point. This can help you answer questions such as "would I be able to see the sea from the window in this apartment?"
Play around with these tools and different settings to gain insights from your data, highlight certain features or create desired visual effects – the options are near limitless and a wealth of information can be hidden in your 3D data.
And, if you need 3D data, check out our map with global 3D building coverage and be sure to get your $50 coupon to start exploring your area of interest today!
