The rapid expansion of global urban landscapes demands tools that allow professionals to visualize, analyze, and interact with 3D building data. In the realm of urban planning and architecture, 3D visualisations are the bridge between a concept and its realisation.
ArcGIS, renowned for its geospatial capabilities, has carved a niche in this area by offering powerful tools to transform raw 3D building data into visually rich and interactive models.
Here, we will give you exact step-by-step instructions on how to get your 3D building data into ArcGIS Pro and adapt it to create captivating visual effects.
If you're using ArcGIS Online, click here for our article specific to visualizing 3D building data in ArcGIS Online.
- If you haven't already got 3D building data for your project or area of interest, download it from our data page. Make sure you use a coupon code to get $50 credit!
- Open ArcGIS Pro and select "New Project", then "Local Scene" and name and save the project.
- Next, you need to convert the JSON data to shapefile or feature class. Therefore, open the "Analysis" tab and click on "Tools" to open the geoprocessing tools.
- Search for "JSON to Features" in the geoprocessing toolbox.
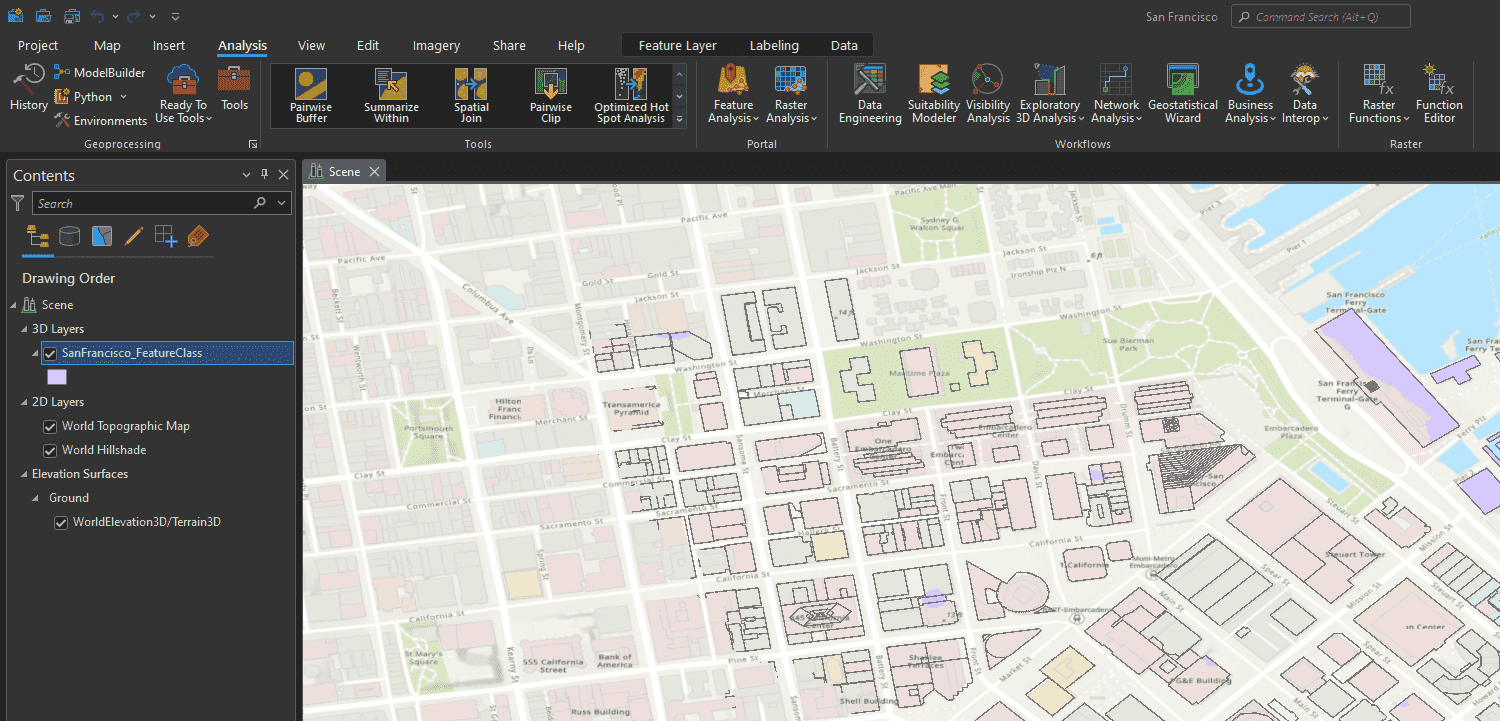
- Select the JSON file for the input and the output (which you can rename as you like) is automatically generated once you "run" the application. Once you have run the tool, it will automatically add the feature layer to your table of contents under "3D layers" and zoom to the correct location in this case San Francisco.
- The data appears as a flat (2D) layer. To turn this into a 3D layer, the following 2 steps are necessary:
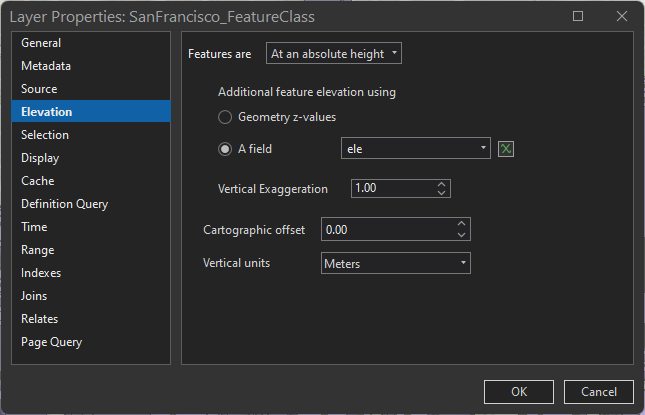
- To define the base elevation (ground elevation), right-click on the data layer and select "Properties" under "Elevation", change "Features are" to "at the absolute height" and set the "Additional feature elevation using" to "ele".
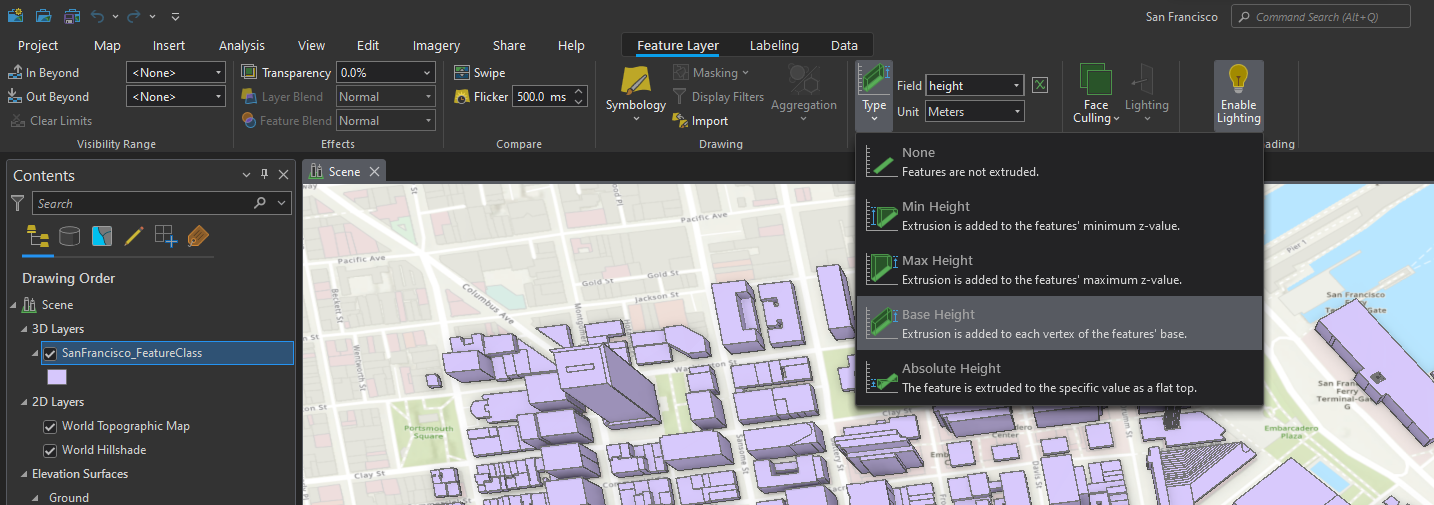
- Select the data layer and click on "Feature layer" at the top and change the "Type" to "base height" and change the "Field" to "height".
That's it your data is in ArcGIS as a 3D layer, ready to use for analysis or visualization! ArcGIS offers hundreds of tools for data processing, analysis and visual effects.
Here, we will introduce a few simple steps to change the look of the 3D building data in ArcGIS to create visually appealing effects.
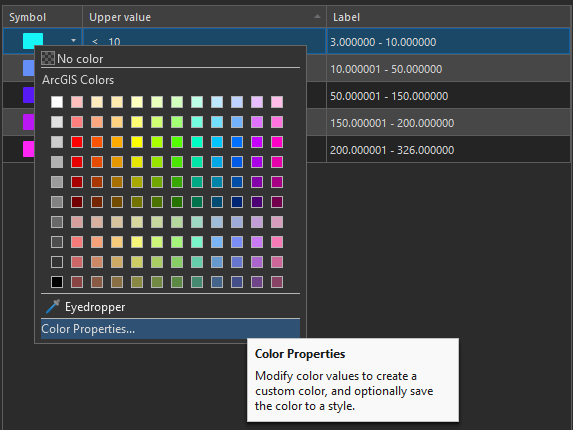
- To change the symbology, right-click on the data layer and click "Symbology". Under "Primary symbology", select e.g., "graduated colours" to change the colour as a function of the building height.
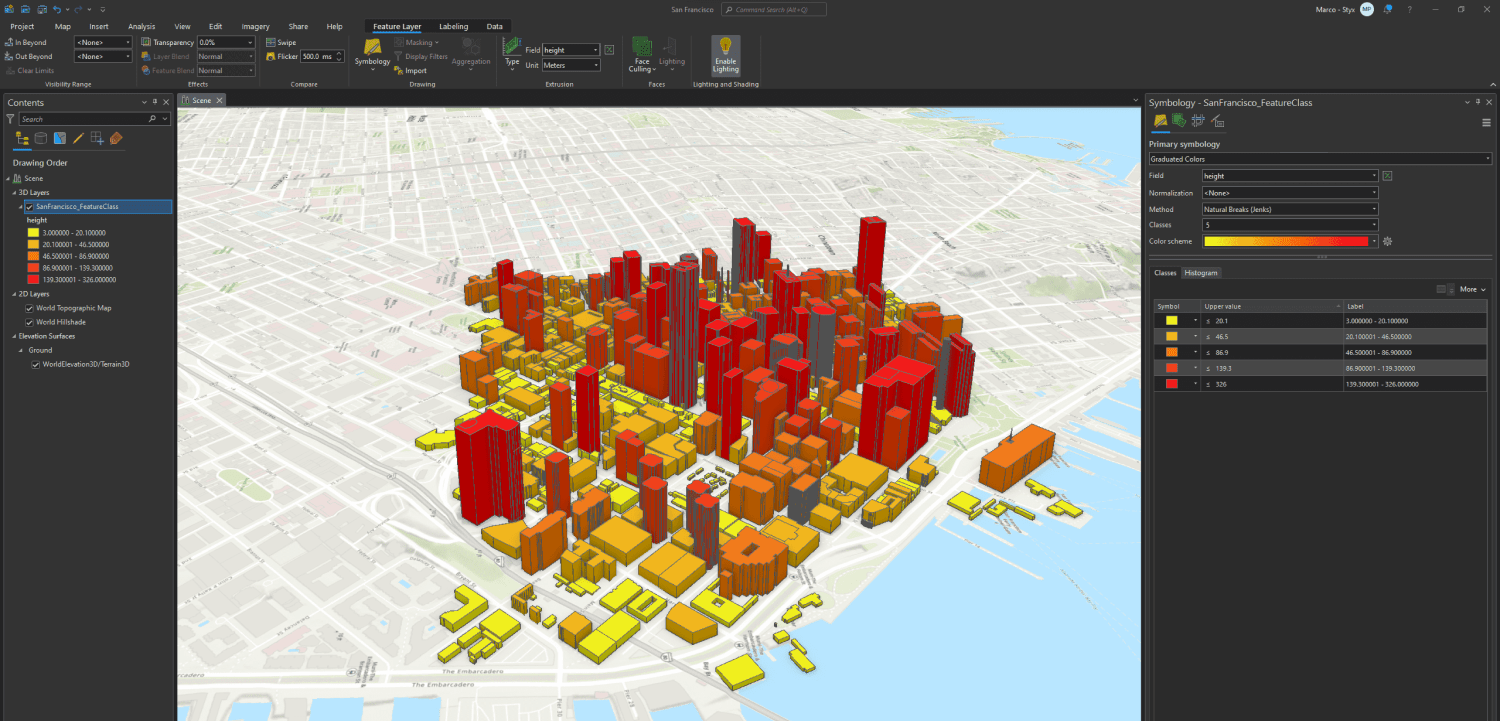
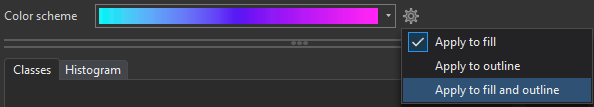
- You can change the colour using the "Colour scheme" selection and set the intervals using the "Method" selection. You can change the building outline colour by clicking on the settings icon and selecting "apply to fill and outline" to have the same colour settings applied to the fill and the outline colours.
- Click on each colour under "Symbol" and select "Colour properties" and change the transparency to e.g., 40.
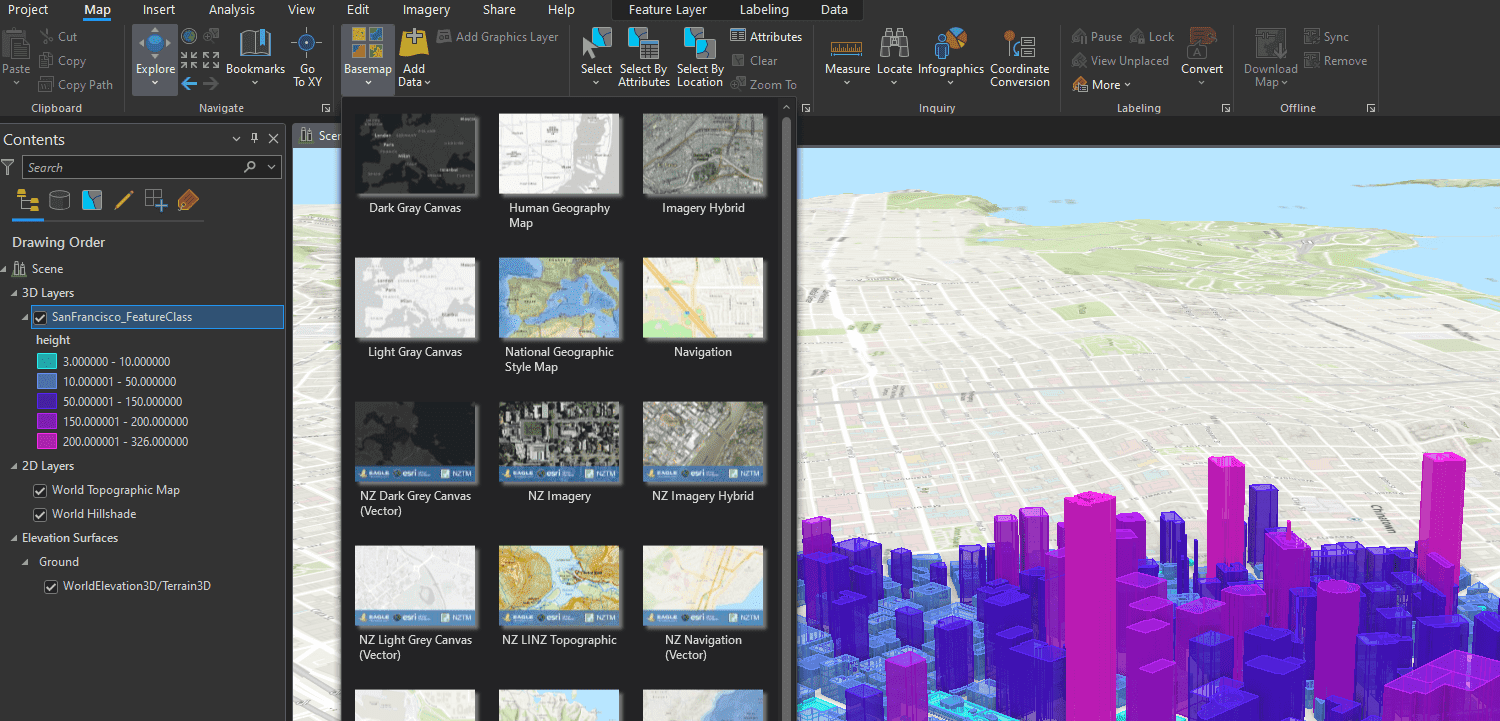
- To change the basemap colour, click on "Map" and select the basemap you would like to use, e.g., "street night".
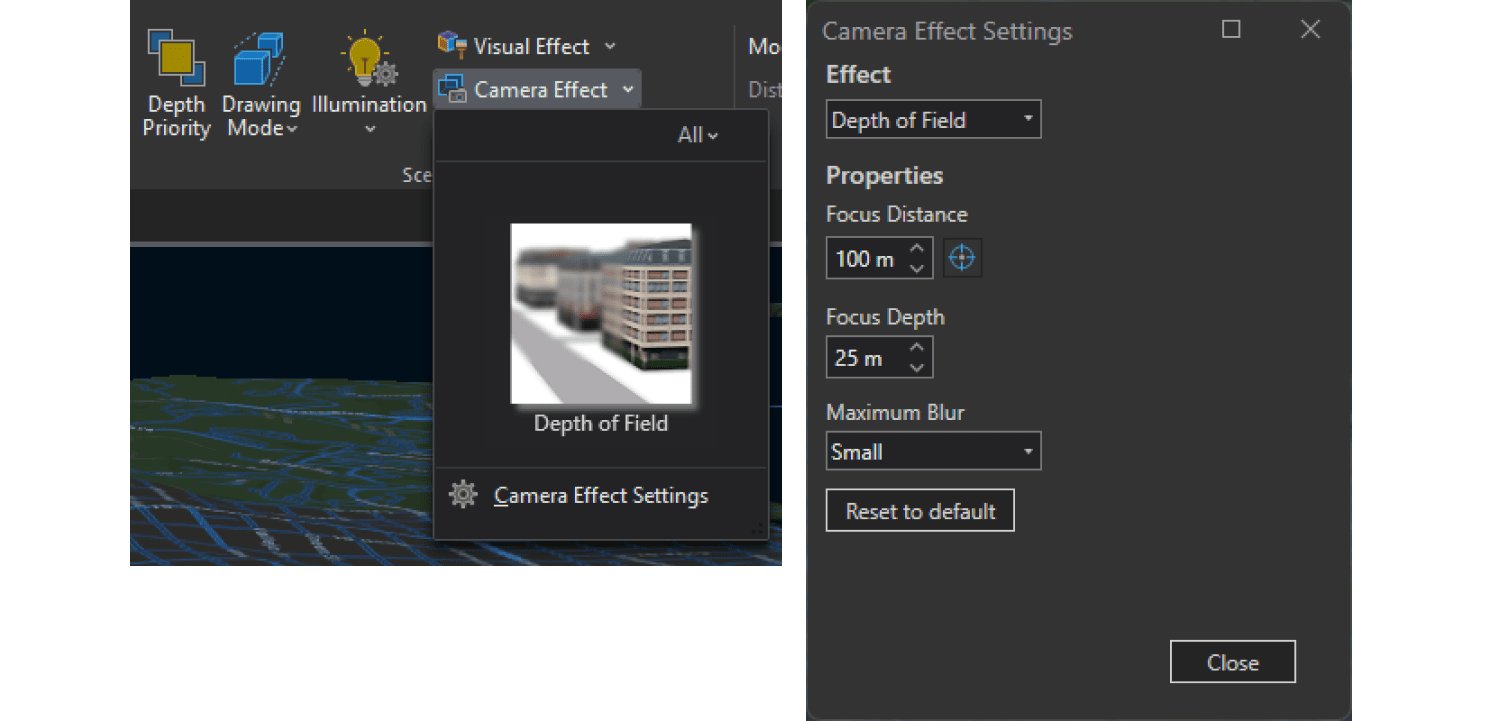
- To change the depth of field (i.e., create a blurry background), click on "View" and select "Camera effect", then "Camera effect settings", and "Activate". You can then change the "Focus distance" by clicking on the cross-heirs symbol and selecting the area you would like to have in focus on the map and then change the "Focus depth" to e.g., 500m to create the desired effect.
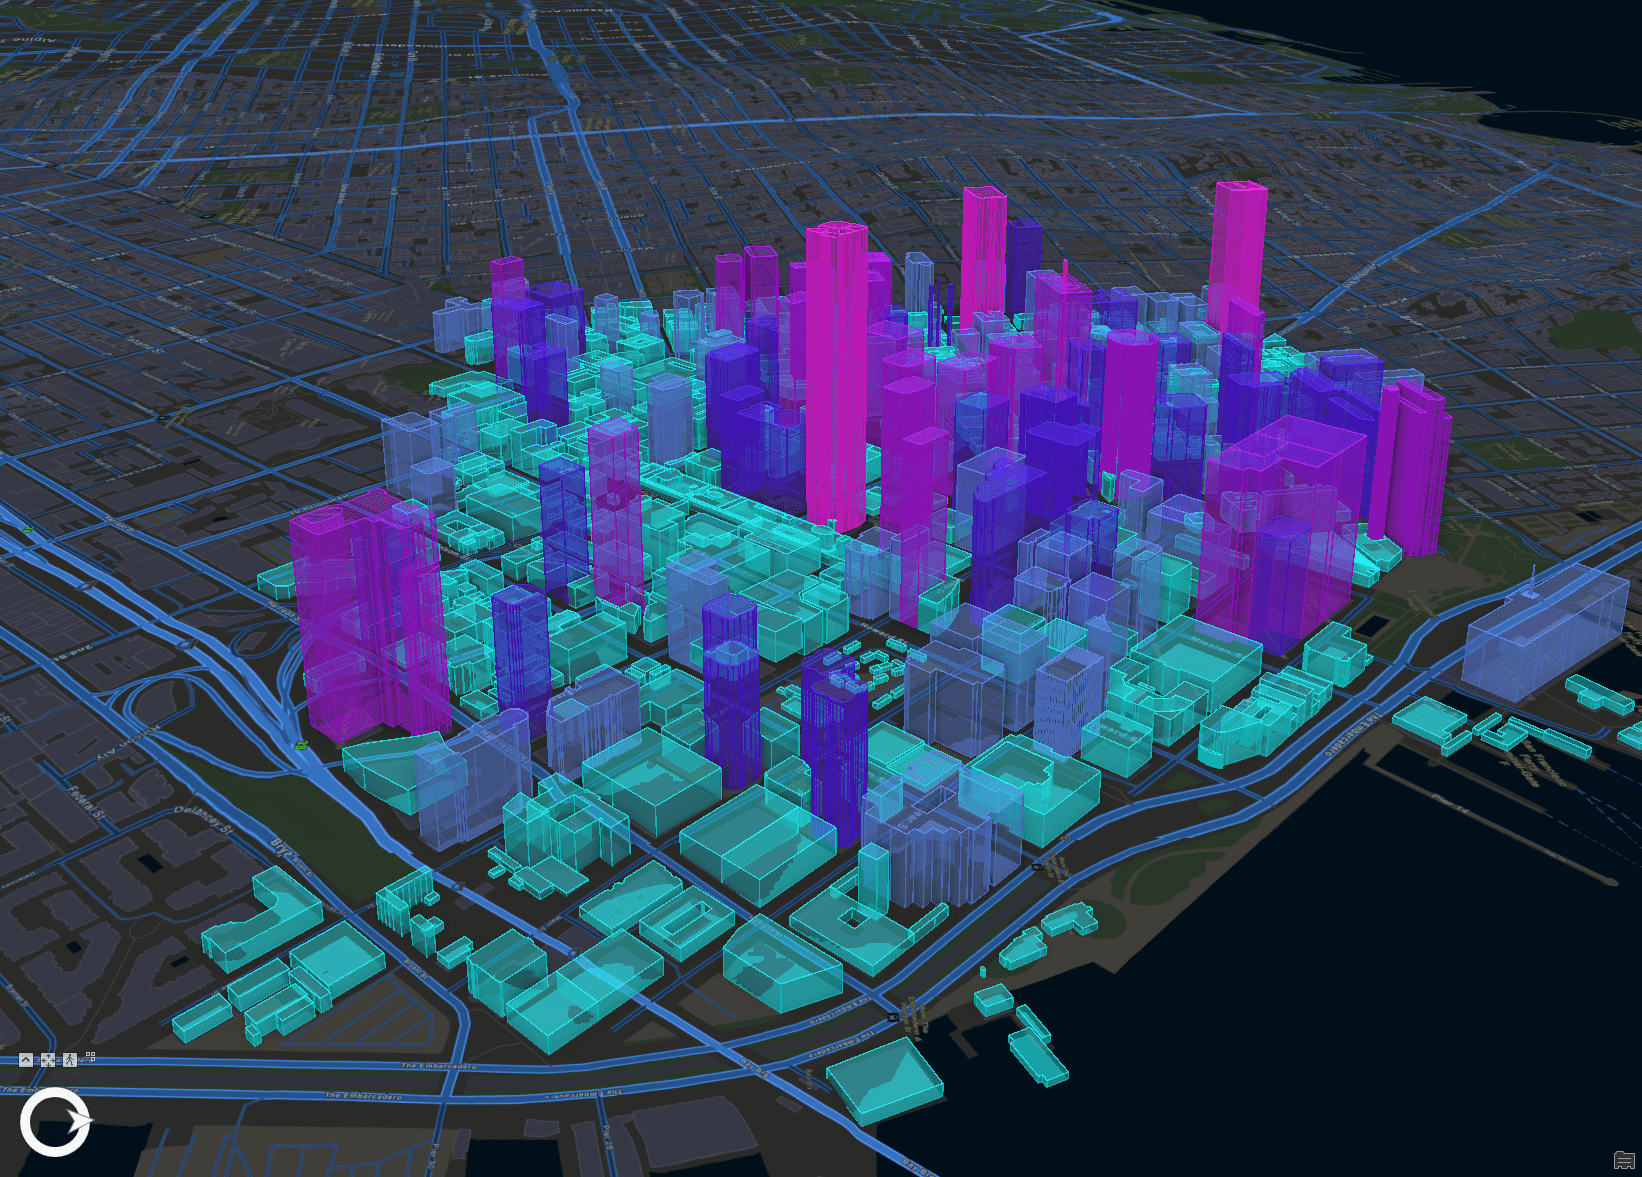
Play around with any of these settings to highlight certain features or create desired visual effects the options are near limitless.
Remember, in this digital age, a well-visualised design can be the difference between a blueprint and a breakthrough. Happy visualizing!
If you're ready to try out our augmented open data, get your $50 coupon here.